Bitcoin is in the middle of a pullback move from last week's high, above $ 10,500. Besides, the critical support at $ 9,700 has been broken, forcing the bulls to focus on defending the next support target at $ 9,600. Is it time to buy the bottom?
Bullish flag pattern
The formation of a rising flag pattern indicates that further bullish action can only continue if the support level of the pattern is not broken.
However, a break of the flag's support level can lead to a terrible decline, which could reach as high as $ 9,000.
Daily BTC / USD chart
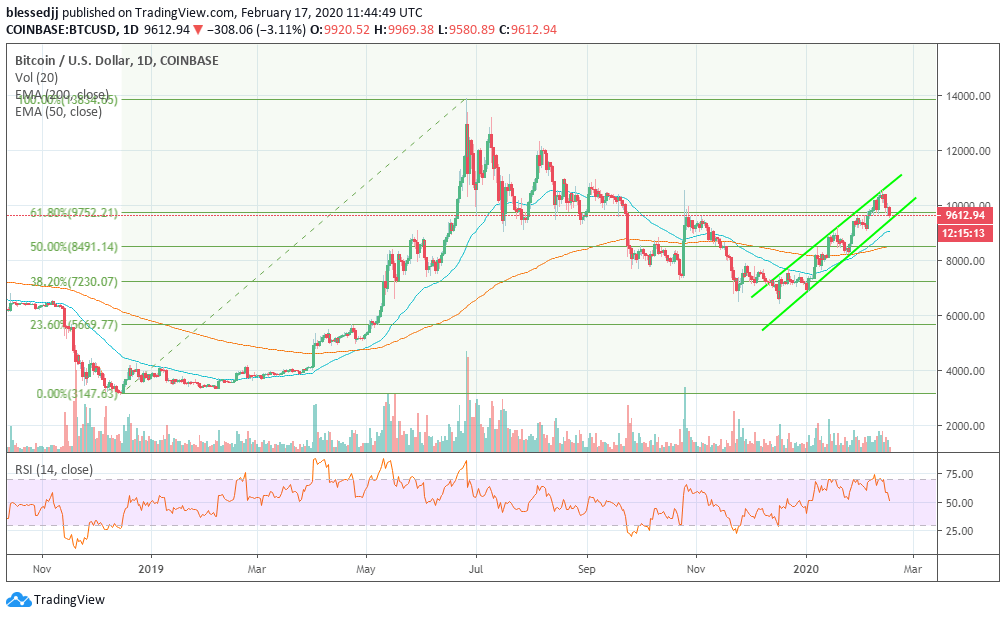
All technical indicators signal a downtrend, making the view that "the bull run has ended" more firmly.
The RSI indicator, for example, is heading below average (level 50). The steep decline is a clear indication that the selling power is impacting the expected support areas.
On the more optimistic side, BTC / USD is still trading above the 200-day SMA. Moreover, the 50-day SMA is above the 200-day SMA to indicate that buying power is not entirely non-existent.
However, the bulls need a good push to break out of the bear trap. A bullish reversal is possible but only if the support of $ 9,700 is restored.
Besides the support of $ 9,600, Bitcoin needs to find a balance in lower regions such as $ 9,200, $ 8,800, Fib 50% and $ 7,200.
Summary of the current situation of Bitcoin
Trend: Strong discount
Volatility: High
Current price: $ 9,576

0 Comments